Prometheus Exporter
The observability of SRS is about metrics(Prometheus Exporter), tracing(APM) and logging(Cloud Logging).
Introduction
For detail specs, please read OpenTelemetry.

Note: Please see Metrics, tracing, and logging
The architecture for Prometheus exporter:
+-----+               +-----------+     +---------+
| SRS +--Exporter-->--| Promethus +-->--+ Grafana +
+-----+   (HTTP)      +-----------+     +---------+
There is special config for exporter.
Config
The config for exporter is bellow. Highly recommend using environment variables to enable it:
# Prometheus exporter config.
# See https://prometheus.io/docs/instrumenting/exporters
exporter {
    # Whether exporter is enabled.
    # Overwrite by env SRS_EXPORTER_ENABLED
    # Default: off
    enabled off;
    # The http api listen port for exporter metrics.
    # Overwrite by env SRS_EXPORTER_LISTEN
    # Default: 9972
    # See https://github.com/prometheus/prometheus/wiki/Default-port-allocations
    listen 9972;
    # The logging label to category the cluster servers.
    # Overwrite by env SRS_EXPORTER_LABEL
    label cn-beijing;
    # The logging tag to category the cluster servers.
    # Overwrite by env SRS_EXPORTER_TAG
    tag cn-edge;
}
Let's start SRS exporter to export metrics to Prometheus.
Usage for SRS Exporter
Build and start SRS 5.0.86+:
./configure && make
env SRS_ENV_ONLY=on SRS_EXPORTER_ENABLED=on SRS_LISTEN=1935 \
  ./objs/srs -e
Note: We use envrionment variables to config SRS, without config file. However, you're able to use config file
conf/prometheus.confto start the demo.
Note: Please open http://localhost:9972/metrics to verify SRS.
Then, use FFmpeg to push a live stream to SRS:
docker run --rm -it ossrs/srs:encoder ffmpeg -re -i doc/source.flv -c copy \
  -f flv rtmp://host.docker.internal/live/livestream
Next, run node_exporter to collect the node data:
docker run --rm -p 9100:9100 prom/node-exporter
Note: Highly recommend downloading from here and startting by binary file.
Note: Please open http://localhost:9100/metrics to verify it.
Finally, create a prometheus.yml for prometheus:
scrape_configs:
  - job_name: "node"
    metrics_path: "/metrics"
    scrape_interval: 5s
    static_configs:
      - targets: ["host.docker.internal:9100"]
  - job_name: "srs"
    metrics_path: "/metrics"
    scrape_interval: 5s
    static_configs:
      - targets: ["host.docker.internal:9972"]
Note: We set the
scrape_intervalto5s, which is default to1mor one minute.
Start Prometheus by:
docker run --rm -v $(pwd)/prometheus.yml:/etc/prometheus/prometheus.yml \
  -p 9090:9090 prom/prometheus
Please ope Prometheus: Targets, or Prometheus: Graph to query the input bitrate:
rate(srs_receive_bytes_total[10s])*8
This query is used to query the input bitrate, which is the bitrate of stream:
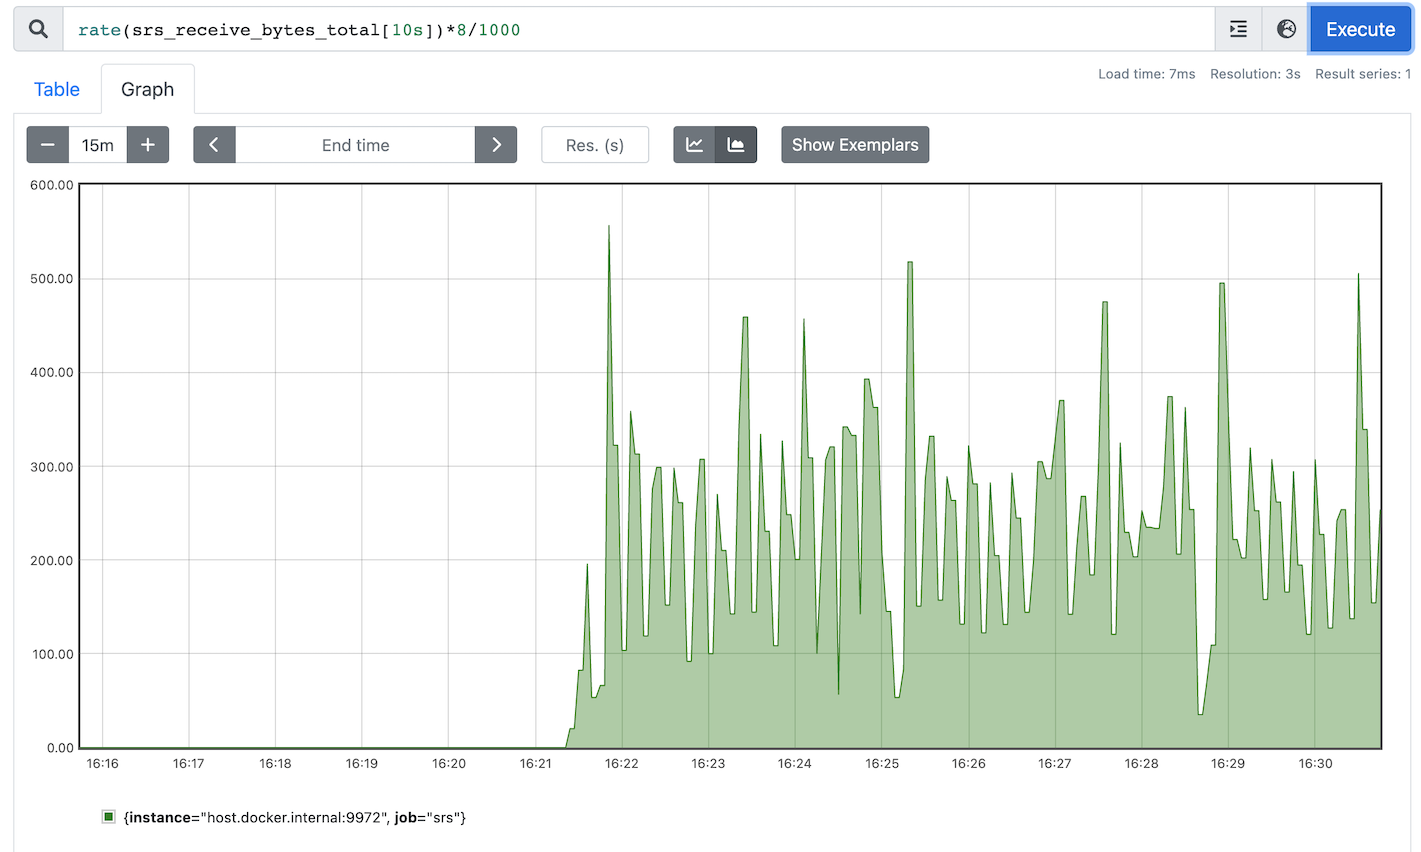
Normally we use Grafana to render the graph.
Usage for Grafana
First, start Grafana in docker:
docker run --rm -it -p 3000:3000 \
  -e GF_SECURITY_ADMIN_USER=admin \
  -e GF_SECURITY_ADMIN_PASSWORD=12345678 \
  -e GF_USERS_DEFAULT_THEME=light \
  grafana/grafana
Please access Grafana console by http://localhost:3000/
Note: Please input username
adminand password12345678then click login.
Run command to add a Prometheus DataSource:
curl -s -H "Content-Type: application/json" \
    -XPOST http://admin:12345678@localhost:3000/api/datasources \
    -d '{
    "name": "prometheus",
    "type": "prometheus",
    "access": "proxy", "isDefault": true,
    "url": "http://host.docker.internal:9090"
}'
Run command to import the HelloWorld dashboard:
data=$(curl https://raw.githubusercontent.com/ossrs/srs-grafana/main/dashboards/helloworld-import.json 2>/dev/null)
curl -s -H "Content-Type: application/json" \
    -XPOST http://admin:12345678@localhost:3000/api/dashboards/db \
    --data-binary "{\"dashboard\":${data},\"overwrite\":true,\"inputs\":[],\"folderId\":0}"
Note: For other dashboards, please see srs-grafana.
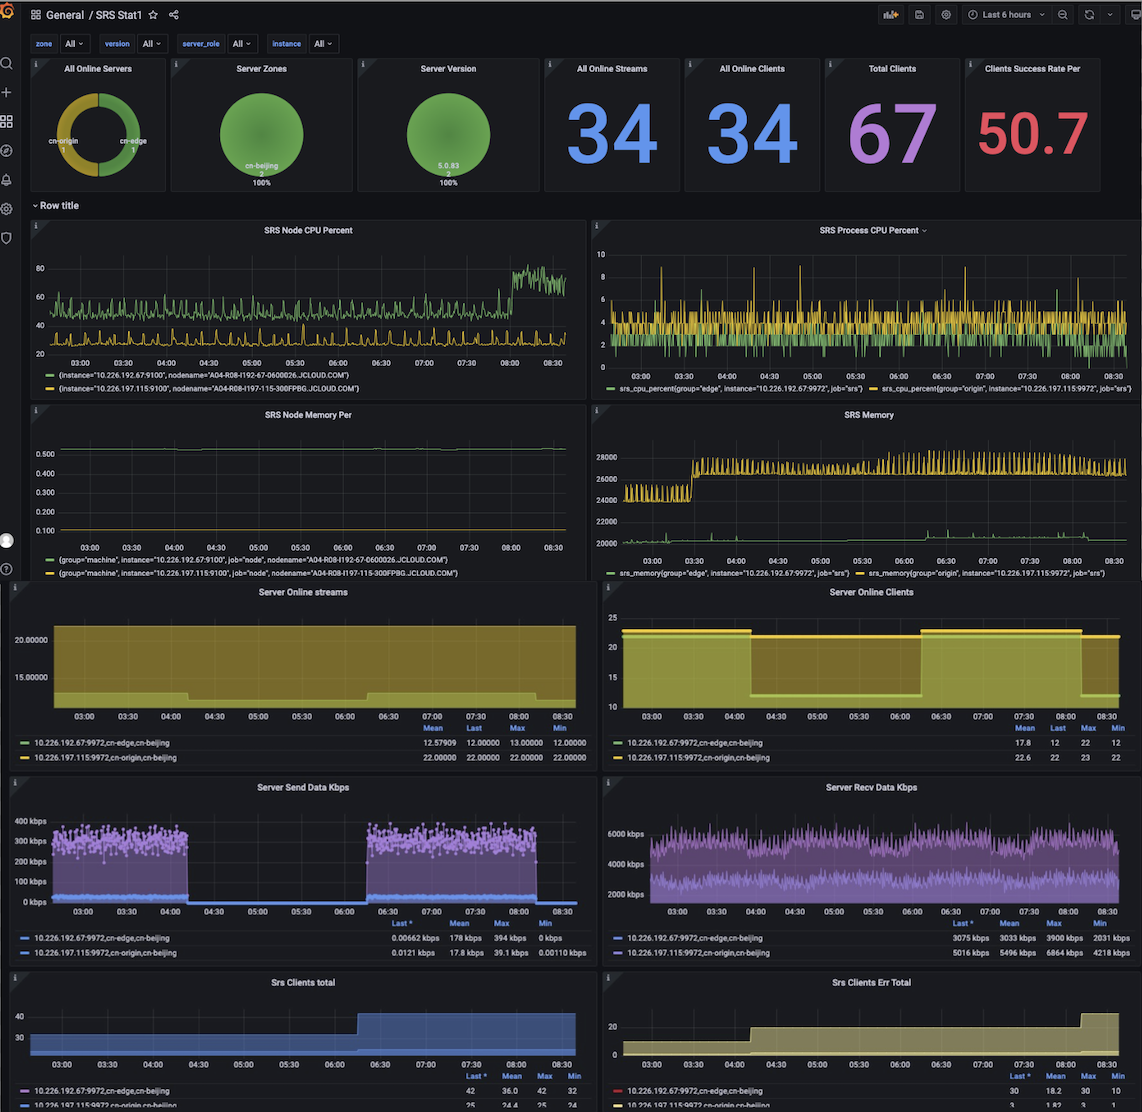
Then open Dashboards in browser, you will see the imported dashboard:
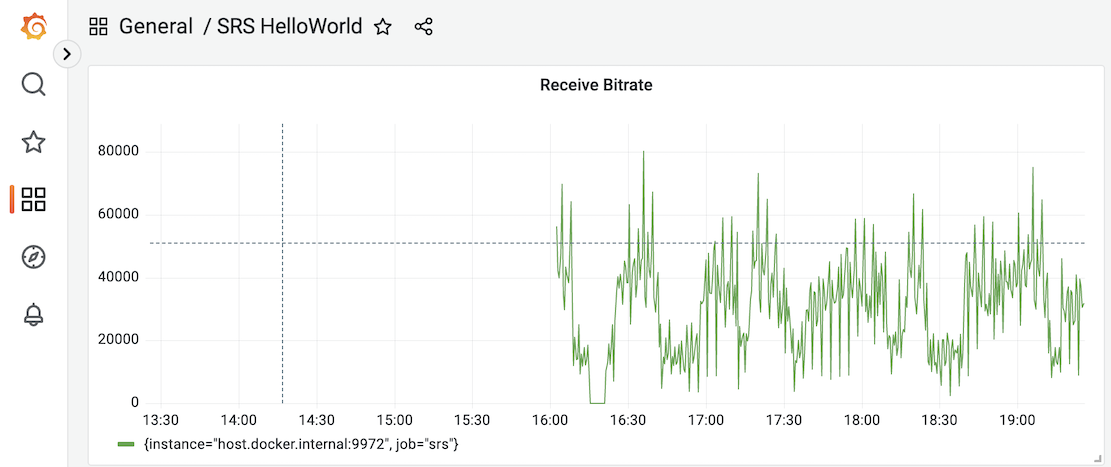
There are more other dashboards, please get them in srs-grafana.
Any patch is welcome.
